Monitoring Intel® SGX Enclaves

Intel® Software Guard Extensions (Intel® SGX) enclaves allow users to execute cryptographically signed code in a protected memory region, safe from kernel-mode, or even SMM-mode, access. Code is attested by the CPU, and can then be remotely verified. This allows secure execution of code even in a cloud environment, where users have no control over the underlying hardware. However, standard Linux tools don’t give you visibility into SGX enclaves.
Say you’re trying to develop such code. Things are running slowly – are there other enclaves running? Is there enough enclave memory available?
Or you want to deploy enclave-dependent code. How busy are the systems running enclaves? Are too many running? Is there room for more? How do you monitor systems over time?
If you want to know what disk partitions are available on your Linux host, and how full they are, you can use the lsblk and df commands to check. If you want to know how much memory and swap you have, you can use free to see that, and ps to see which processes are using that memory.
Until now, no similar tools existed to show you what Intel® SGX enclaves are running on your systems. The good news is that Fortanix is releasing prototype patches for the Intel® SGX Linux driver to allow easy access to this information, along with the sgxtop utility to use that data. (www.github.com/fortanix/linux-sgx-driver and www.github.com/fortanix/sgxtop)
sgxtop
To try out sgxtop, build and install our updated SGX driver and build and run sgxtop – you can run it as a regular user (no permissions necessary). It will clear the screen, then, like top, display the enclaves running on the system.
On a busy system, you’ll see something like this:
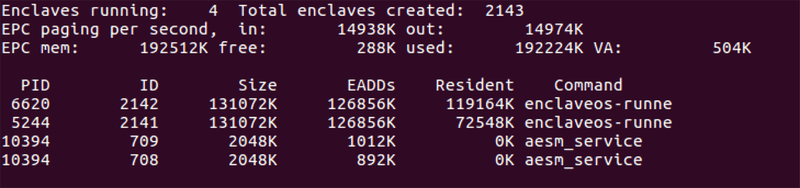
This is a Fortanix development machine – it’s currently running four enclaves, and since the driver has been started, 2143 enclaves have been created. That’s probably more enclaves than a typical production machine would see. Especially large values here might indicate frequently failing enclaves.
Below that, we see the page-in and page-out rates; if these are unusually high, you know your system is running short of EPC memory (or is paging in a new enclave). 14MB/sec is low – we’ve seen maximum values considerably higher than 500MB/sec paging in large enclaves on fast systems.
Then we see memory statistics. Intel® SGX allocates protected memory at boot time, and isolates that from the rest of the system. This Enclave Page Cache (EPC) can be up to 256MB on currently released hardware. This space is shared between the enclaves on the system. Linux (but not Windows) supports EPC memory paging so that we can overcommit the EPC. The driver round-robins between enclaves, paging out least-recently used memory.
This system has 256MB dedicated to EPC; internal housekeeping uses 64MB of that space, so that we have around 192MB of EPC available for use on this system. Very little is free – busy enclaves tend to page in and out quickly and use free memory, and, of course, most of the memory is used. Finally, the Version Array (VA) space dedicates 8 bytes of integrity data for every 4KB page swapped out.
The final five lines show the active enclaves on the system. The two aesm_service enclaves are Intel housekeeping enclaves – one generates launch tokens, and the other does remote attestation. Both are paged out completely, as the newly instantiated enclaves required that space. They’ll page back in if we need to launch another enclave.
The two other enclaves are running Fortanix EnclaveOS™, and have allocated considerably more memory. The older enclave has paged out some memory (no problem, its’ working set size is small), while the newer enclave has still has most of the memory it required when starting up.
The sgxtop fields are the PID of the owner process (the same for both of the Intel enclaves, but generally different for Fortanix tools), a monotonically-increasing ID defined by the driver, the declared maximum size (a power of two) of the enclave, the actual memory added to the driver when it was created (often much less than the size), the memory currently resident for the enclave, and the name of the command that created the enclave.
We have a similar sgxstat command that shows a single snapshot of the enclaves, without continuous updates.
Logging
But if you’re simply interested in logging system data over time, you don’t need a pretty display. You can go directly to the two files that expose this information, /proc/sgx_stats and /proc/sgx_enclaves.
Dump them to a database every minute or so, and you can track SGX stats along with all of your other important metrics. But that’s a topic for another blog.
Conclusion
sgxtop provides useful information for SGX developers and deployers. Please take a look at the code on github, try it out, provide feedback, and maybe contribute patches! We’d love to hear from you.